Claude Office: Sheets, Whiteboards & Data Tested
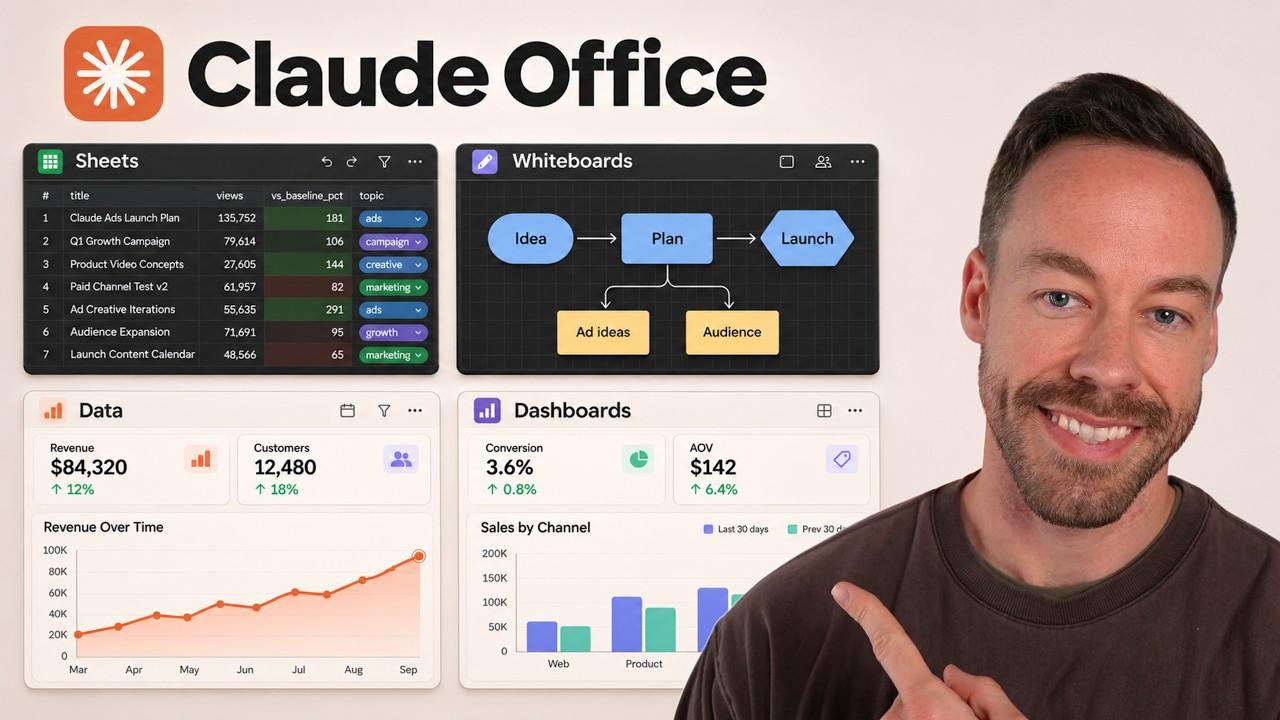
Anthropic just shipped Claude Sheets, Claude Whiteboards, and Claude Data. I tested all three on real YouTube channel data. Here's what works, what doesn't, and when to actually use them.
Want to learn Claude Code?See the Claude Code Masterclass
On this page
Anthropic just released Claude Sheets, Claude Whiteboards, and Claude Data in the same week, and they're all aimed squarely at office work. No, Claude didn't kill Excel overnight. But it took a real first step, and I tested every one of these new tools on my own YouTube channel data to see what they actually do. Here's exactly how they work and how to get the most out of them.
All three are artifacts — miniature applications Claude builds right inside its own interface. You can use them in regular Claude chat or in Claude Code. To open one, click Artifacts on the left sidebar, or just start a new chat and say "create me a board," "create a table," or "build me a data dashboard." Natural language is enough; you don't need to hunt through menus.
What Are Claude Whiteboards?
Claude Whiteboards is an endless canvas and a direct analogue to Excalidraw. You can draw diagrams by hand, or hand the job to Claude and let it draw them for you. You can also drop in live mini-applications — I built a token calculator on the board where changing the input tokens instantly recalculates the cost right on the canvas.
It's built to be a collaborative space. You can run real-time polls, leave sticky notes for colleagues, and let Claude read and edit the same board you're working on. There's a chat docked at the bottom of the canvas where you tell Claude what to do, and you can leave a comment on any individual widget.
Here's where it gets interesting: those comments can go two ways. Click a chart, add a comment like "can you change the style to neo-brutalism?", and you either leave it for a human colleague to answer or fire it straight at Claude. When I sent it to Claude, it highlighted the entire chart, showed a working icon, and restyled it in place — then moved on to reshape another part of it on its own.
Every board is tied to the chat that created it. A chat button in the top-right corner jumps you back to the original conversation, and the share button next to it hands the board to someone else. You're never locked into letting Claude do everything either — you can edit the board manually whenever you want.
Where Whiteboards Actually Shines
The real value, in my testing, is as a visual aid during presentations. I used to do this constantly in Excalidraw: open a canvas, grab the pencil, point at objects, circle the thing that matters. Claude Whiteboards does that natively now, so there's little reason to leave the app.
The second use case is interactive data visualization. I asked Claude to analyze all my YouTube data since August 25th. It hit the YouTube API, collected the numbers, converted everything into a large CSV, and plotted it on a board. When I hover over a data point, it tells me which video it belongs to — almost a stripped-down dashboard, but easy to drive live on screen. One channel-level reading: roughly 4 million views at a baseline level, all pulled and charted without me touching a spreadsheet.
Is Claude Sheets an Excel Killer?
The short answer is no — not yet. The longer answer is that it's a genuinely useful tool even in its early beta. Claude Sheets is Anthropic's Excel clone, and it ships with what you'd expect: rows, columns, formulas, macros, formatting, drop-down lists, and tabs.
I tested it the same way I tested Whiteboards — by handing it a large CSV of my entire YouTube channel and saying, "get to work." Claude sorted all of it the way you'd hope: titles, formatting, publication dates, percentages, and color coding it applied on its own. I never asked for the color coding. It also spun up a summary tab that rolls everything into a clean, dashboard-style view so I'm not staring at raw data.
The chat and comment model carries over from Whiteboards. Click the chat button and Claude appears on the left. Click any cell, open the context menu, and you can either leave a comment for a teammate or ask Claude directly — "can you explain this number?" — and it starts working exactly as if you'd typed the request into the chat window.
When Should You Use Claude Sheets vs Google Sheets vs Excel?
I actually asked Claude to graph this difference and drop it on a whiteboard, and the answer comes down to usage scenarios:
- Claude Sheets — great for quick trackers, budgets, and lists. It's the right call for simpler work, especially if you want Claude in the loop but don't want to run Claude inside Excel itself.
- Google Sheets — far more powerful for collaboration and scale.
- Excel — still the answer for serious financial modeling or big data.
The hard limits make the boundary obvious. Claude Sheets caps out at 100,000 cells per sheet. Google Sheets allows up to 10 million cells per file, and Excel gives you 1 million rows by 16,000 columns. So if you're modeling finances or wrangling big datasets, stay in Excel for now.
That said, this just launched and it's still in beta. I wouldn't be surprised to see it climb toward Google Sheets parity, and maybe eventually Excel. The best way to test it yourself is to upload a big CSV or XLSX file and let it run — even with a weak prompt, it produces something decent.
What Is Claude Data?
Claude Data is the renamed, upgraded version of Claude Dashboards, and the headline change is live data that updates automatically. I fed it the same YouTube CSV and asked it to build a dashboard in a neo-brutalist aesthetic, and it matched the style exactly. I can filter by Shorts, long videos, or both; see summary numbers up top; and hover any element for the detail behind it.
The new design system control is the part worth paying attention to. You can hand Claude Data a specific color palette, branding, or design language, and it sticks to it across the whole dashboard — so company reports actually look like they belong to your company. Sharing and source-tracing are both one click in the top-right corner.
What Are Scrollyteller, Visual Short, and Visual Analysis?
Claude Data ships four output formats, and each one has a clear reason to exist:
- Dashboard — the standard interactive view with charts and hover detail.
- Scrollyteller — turns the panel into a scrolling story: visuals on the right, explanatory text on the left, with animations that highlight what's changing as you scroll. Strong as a presentation aid.
- Visual Short — converts the data into an actual video with a real audio voiceover narrating the numbers.
- Visual Analysis — another dashboard variant that leans harder on charts; honestly the least differentiated of the four.
The Visual Short is the one that surprised me. It narrated my channel data out loud, and the analysis was sharp. A few of the lines it generated from my own numbers: each square represented one video rated against a typical native-format video; 29 of 59 videos came in below the typical rate, while 16 became hits with at least 1.5x the usual views. Sorted by packaging, "match" style videos led at 197% of typical, followed by "problem-fix" at 133%. My single best test video hit 565% — and even excluding that outlier, the average style score was 135%.
It kept going: long videos get clicked about 7% of the time they're shown, Shorts about 4%; people watch roughly 71% of a short video and 31% of a long one; and the five biggest hits used four different design styles — a reminder to copy what those winners have in common, not just their thumbnails. You're not locked into the auto-generated narrative either. You can prompt it to change the look or steer the story the data tells.
Is Claude Coming for Office Work?
Yes — and Claude Meetings is the clearest signal yet. An hour before I finished testing, Anthropic announced it. On a team or enterprise plan, Claude can join your calls, listen to everything, and then generate documents, whiteboards, and other artifacts straight from the conversation.
I don't have access yet, so I can't put it through its paces. But stack it next to Sheets, Whiteboards, and Data and the direction is unmistakable: if your product touches office work, Claude is moving into your lane. Excalidraw, parts of Excel, Miro-style canvases, dashboard tools — they're all now one natural-language request away inside Claude.
Frequently Asked Questions
What are Claude Sheets, Whiteboards, and Data?
They're three new Claude artifacts aimed at office work. Claude Sheets is a spreadsheet tool, Claude Whiteboards is an endless Excalidraw-style canvas, and Claude Data is a live-updating dashboard builder (formerly Claude Dashboards). All three run inside regular Claude chat and Claude Code.
Can Claude Sheets replace Excel?
Not yet. Claude Sheets handles quick trackers, budgets, and lists well, but it caps at 100,000 cells per sheet versus Excel's 1 million rows by 16,000 columns. For financial modeling or big data, stay in Excel. For lightweight work you want Claude to help with, Claude Sheets is a solid fit.
How do you access Claude's new artifacts?
Click Artifacts in the left sidebar, or open a new chat and ask in plain language — "create me a board," "build a table," or "make a data dashboard." Claude generates the artifact inline, and you can then edit it manually or keep directing it through chat and comments.
What is Claude Data's Visual Short format?
Visual Short turns a data dashboard into a narrated video with a real audio voiceover walking through the numbers. It's one of four Claude Data formats, alongside the standard Dashboard, the scroll-driven Scrollyteller, and the chart-heavy Visual Analysis.
What is Claude Meetings?
Claude Meetings is a newly announced feature for team and enterprise plans that lets Claude join your calls, listen to the conversation, and automatically produce documents, whiteboards, and other artifacts from it. Access is still rolling out.
If you want to go deeper into getting real work done with Claude's new artifacts, join the free Chase AI community for templates, prompts, and live breakdowns. And if you're serious about building with AI, check out the paid community, Chase AI+, for hands-on guidance on how to make money with AI.
Topicsclaudeclaude-sheetsclaude-whiteboardsclaude-dataanthropicai-productivityartifacts